
This project analyzes Netflix's content library using SQL to gain insights into various aspects such as content type distribution, rating trends, genre classification, and regional content availability. The dataset includes information on movies and TV shows available on Netflix, including details like release year, duration, country, director, and description.

Interactive HR dashboard built using Tableau on sample data. Showcases key metrics like employee distribution, education, departmental insights, and gender diversity. Designed to support data-driven HR decisions through clear visual storytelling.
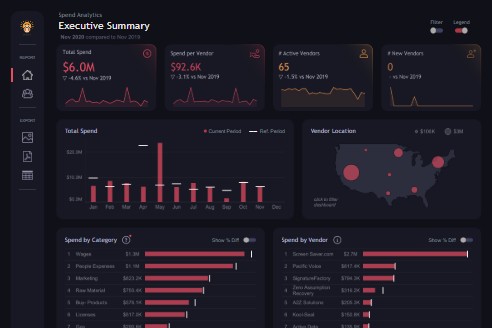
Spends Analytics dashboard created in Tableau using sample business expenditure data. Visualizes spending trends, category-wise costs, vendor analysis, and budget variances. Designed to support smarter financial planning and cost optimization.
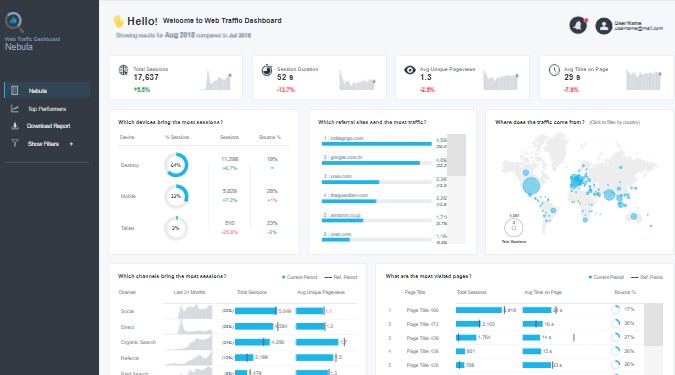
Web Traffic Analytics dashboard built in Tableau using sample website data. Tracks visitor trends, traffic sources, user engagement, and bounce rates. Helps uncover insights to optimize digital strategy and enhance user experience.
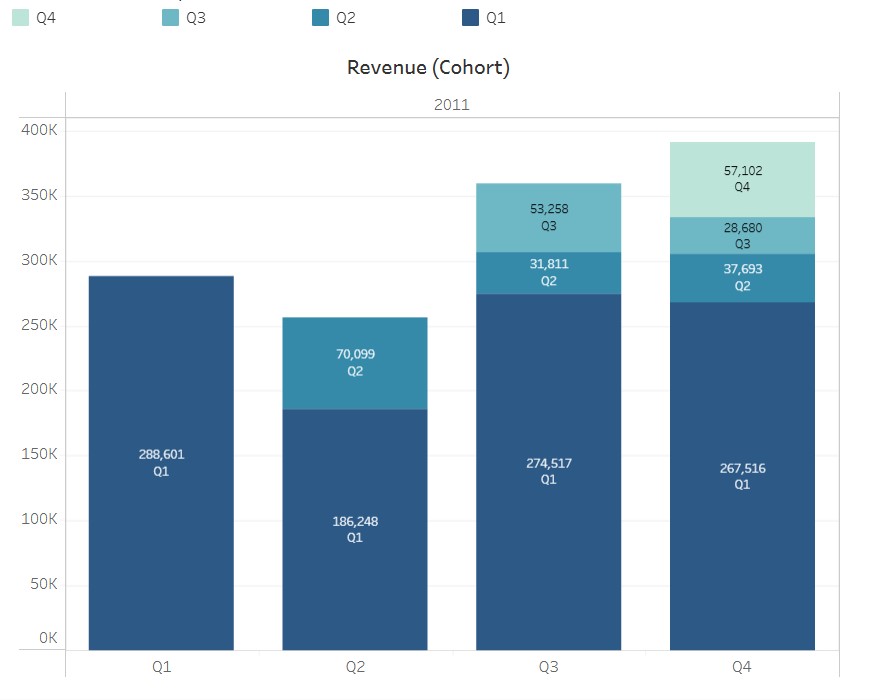
This Tableau dashboard tracks customer retention over time, visualizing cohort groups to help identify trends and patterns in customer loyalty, enabling targeted strategies for improving retention.
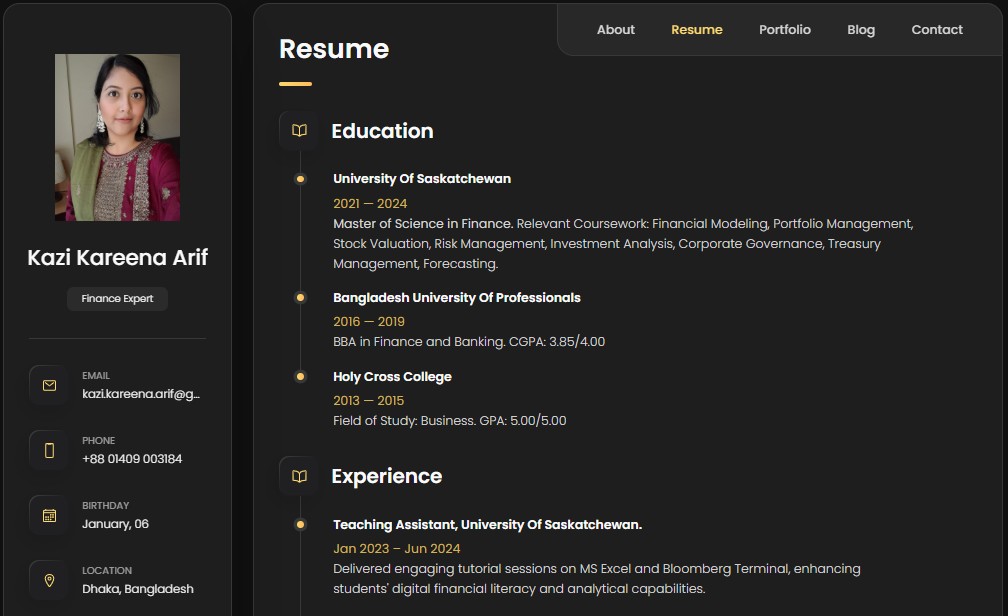
This project delivers a sleek, fully responsive web platform built with HTML, CSS, and JavaScript. Developed for a finance expert, it showcases services and professional highlights in a structured, mobile-friendly design that scales beautifully across all devices.