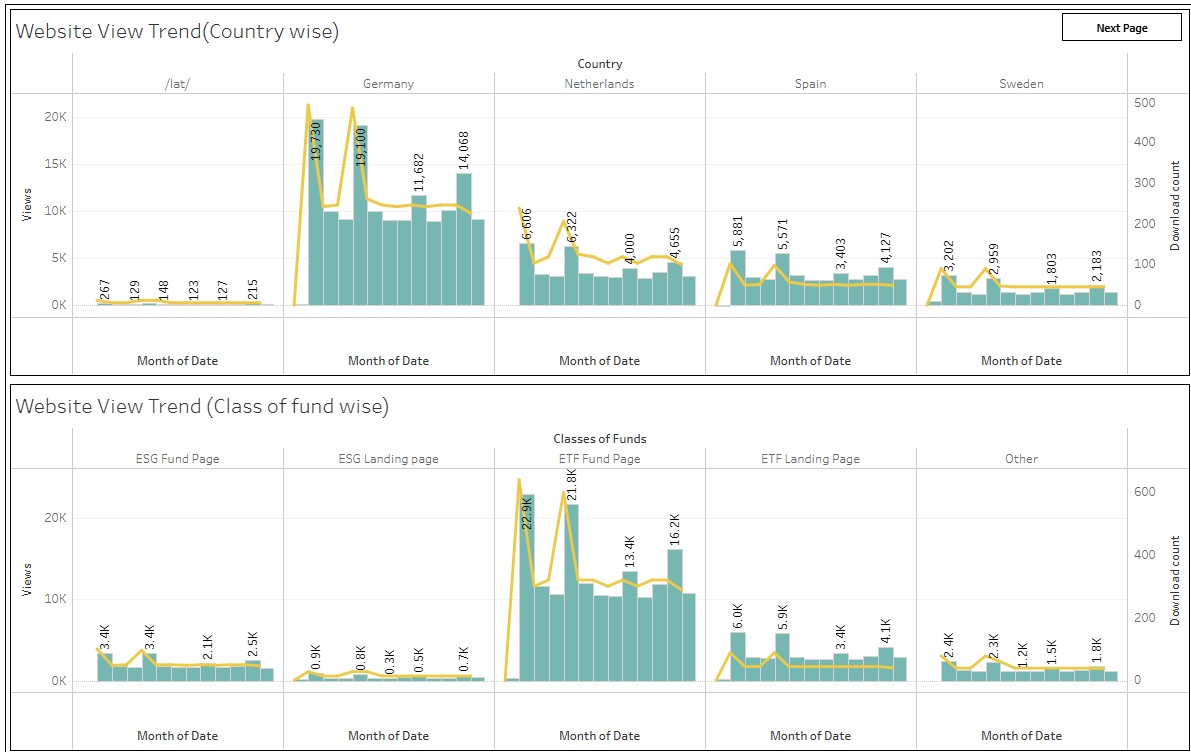
This dashboard explores website visit trends and audience behavior across multiple regions. It highlights engagement patterns with different fund types, tracks user interest over time, and presents top-performing pages and download activities through dynamic monthly and quarterly insights.
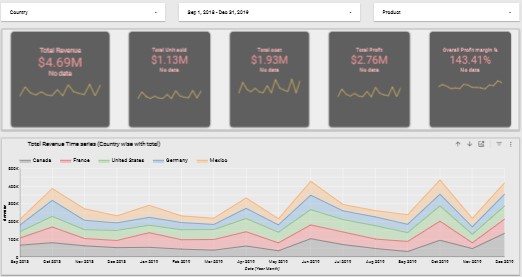
This dashboard provides insights into cookie sales performance, showing key metrics like sales volume, revenue, and customer preferences. It helps track trends, compare product performance, and make data-driven decisions to boost sales.
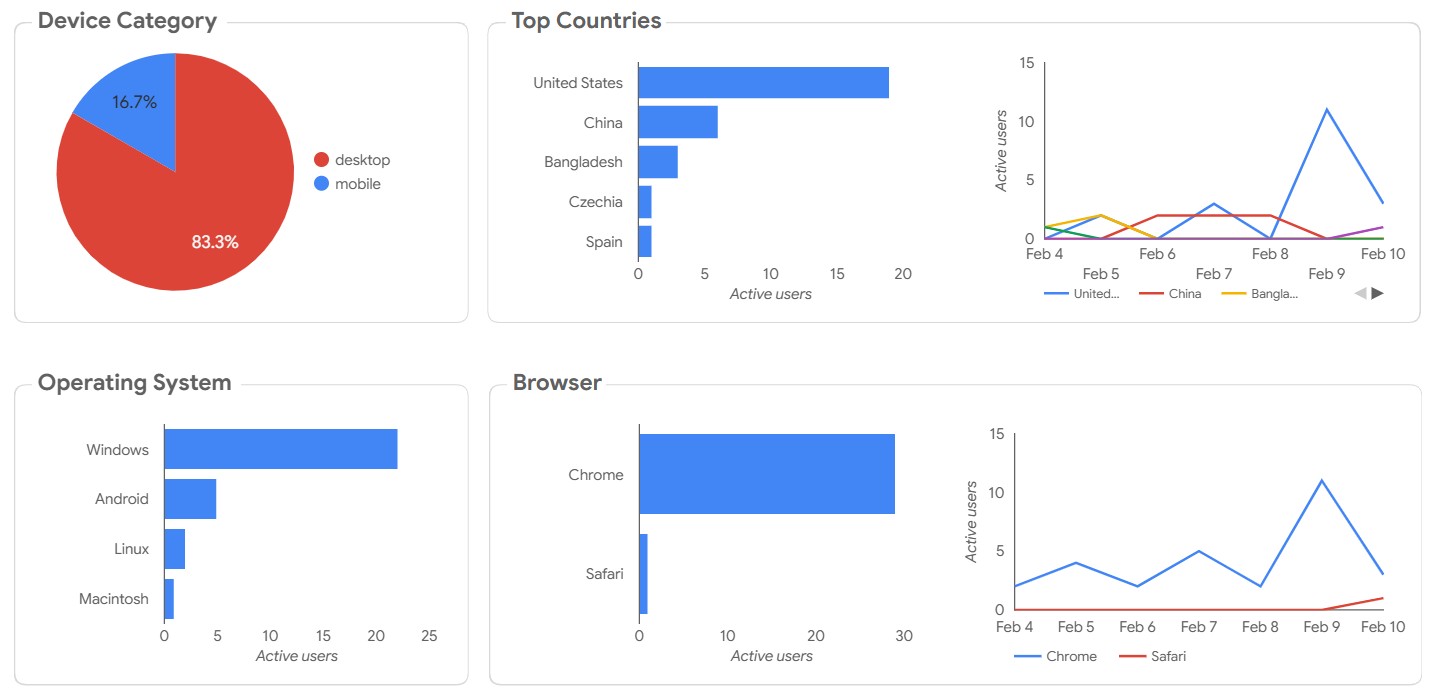
This dashboard gives you a behind-the-scenes look at how people explore my portfolio. Using data from Google Analytics, I track traffic sources, popular pages, and overall performance to understand what captures attention and where I can improve. Think of it as a data-driven snapshot of how my work connects with its audience.
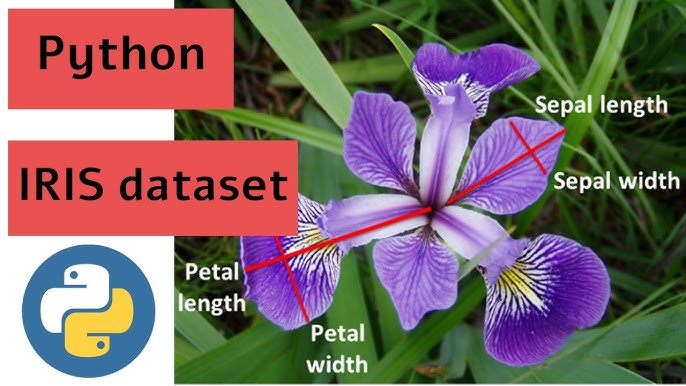
Imagine a box of colorful flowers, and you want to teach your computer to guess their types based on size, color, and shape. In this fun activity, we use Python to help the computer learn from flower data and then test how well it predicts the right flower. You'll see how the computer improves at guessing, just like how we get better with practice!